ATLANTA, July 28, 2026 – The Coca‑Cola Company today reported second quarter 2026 results. “We delivered another strong quarter by staying close to the changing needs of our consumers and customers,” said Henrique Braun, CEO of The Coca‑Cola Company. “While we continue to see a dynamic consumer landscape, we leveraged our powerful brands and system to gain value share, delivering revenue, profit and earnings growth while also investing for the long term.”
Highlights
Quarterly Performance
- Revenues: Net revenues grew 7% to $13.4 billion, and organic revenues (non-GAAP) grew 6%, driven by a 4% increase in concentrate sales and 2% growth in price/mix. Concentrate sales were 1 point behind unit case volume due to the timing of concentrate shipments.
- Operating margin: Operating margin was 34.9% versus 34.1% in the prior year, and comparable operating margin (non-GAAP) was 35.6% versus 34.7% in the prior year. Operating margin performance included items impacting comparability, as well as currency tailwinds. Comparable operating margin (non-GAAP) expansion was driven by organic revenue (non-GAAP) growth, lower operating expenses and currency tailwinds, partially offset by higher input costs and an increase in marketing investments which was partially due to timing.
- Earnings per share: EPS grew 16% to $1.03, and comparable EPS (non-GAAP) grew 11% to $0.97. EPS performance included the impact of a 4-point currency tailwind, while comparable EPS (non-GAAP) performance included the impact of a 2-point currency tailwind.
- Market share: The company gained value share in total nonalcoholic ready-to-drink (“NARTD”) beverages.
- Cash flow: Year-to-date cash flow from operations and free cash flow (non-GAAP) were $7.5 billion and $6.9 billion, respectively.
Company Updates
- Activating the FIFA World Cup™ behind a single, globally connected campaign: The FIFA World Cup™ provided a unique opportunity for the company to activate a campaign at unprecedented scale across more than 180 markets. Before the start of the tournament, the company’s FIFA World Cup™ Trophy Tour made more than 70 stops across approximately 30 markets and reached approximately 700,000 fans. Experiential activations, customer partnerships and retail programs spanning more than 20 million retail outlets also built consumer connections. Digital and social activations generated more than 60 billion impressions and over 9 billion views, supported by more than 2,500 content creators, helping Trademark Coca‑Cola become the #1 brand by share of voice during the tournament and leading to record-setting engagement with Powerade. The company also leveraged connected packaging to engage more than 80 million consumers and collect more than 25 million first-party data records, which can be used to tailor future marketing campaigns. By combining global scale with local execution, the company’s FIFA World Cup 2026™ campaign contributed to a portion of both 5% volume growth for Trademark Coca‑Cola and 8% volume growth for Powerade during the quarter.
- Scaling consumer-led innovation to create new sources of growth: The company is establishing innovation hubs across each of its operating units to translate consumer insights into locally relevant innovations to capture more drinking occasions. This approach allows the company to lift and shift successful innovations faster across markets. One example is Coca‑Cola Zero Zero, which has redesigned packaging that better connects with consumers and meets demand for great taste with zero sugar, zero calories and zero caffeine. The offering is being extended to markets across Asia Pacific and Latin America following strong results and consumer reception in Europe. In China, the company adapted its U.S. Sprite+Tea innovation with a lemon-forward flavor profile that resonates with local Chinese consumers and supported Sprite’s volume growth during the quarter. The company is also expanding functional offerings to meet evolving consumer needs, including a sparkling sports drink, BODYARMOR FIT, which combines zero sugar with electrolytes and caffeine and provides metabolism support. In aggregate, innovation contributed to the company’s 5% volume growth during the quarter, reflecting its focus on improving speed to market and making innovation work harder across more brands and markets.
Operating Review – Three Months Ended July 3, 2026
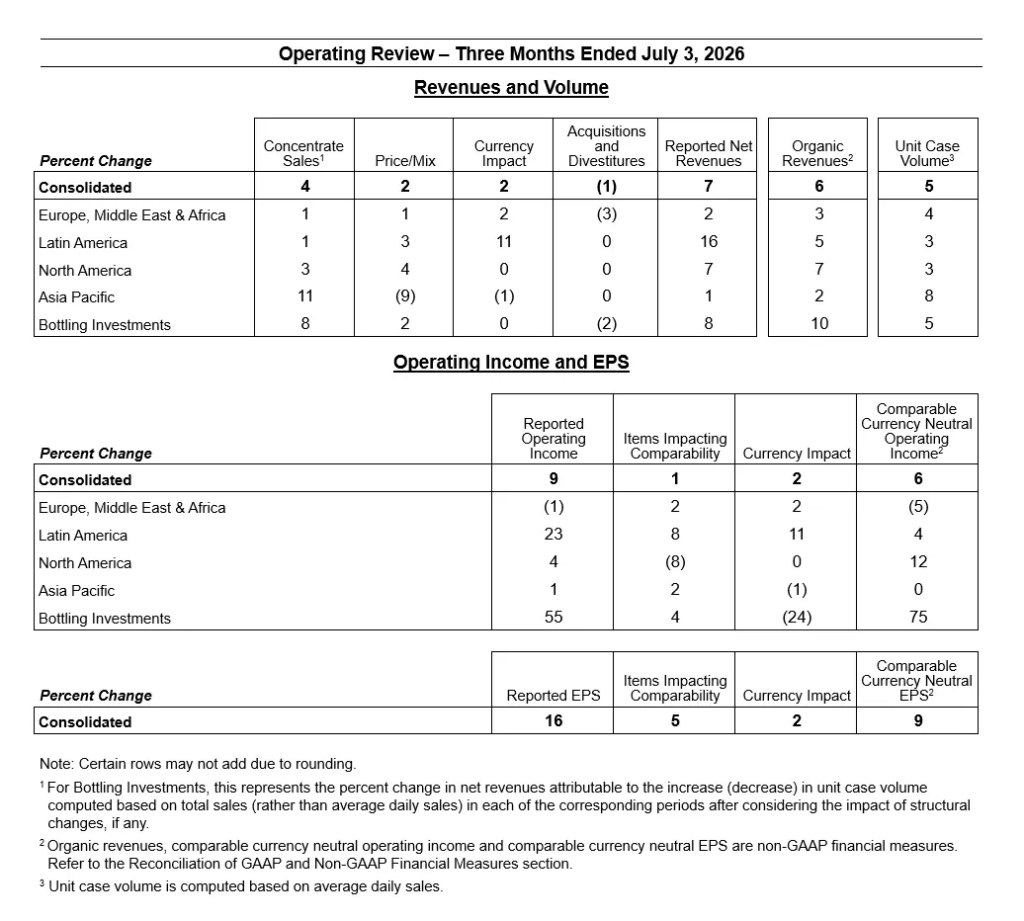
In addition to the data in the preceding tables, operating results included the following:
Consolidated
- Unit case volume grew 5%, led by India, China, the United States and Brazil. Performance included the following:
- Sparkling soft drinks grew 4%. Trademark Coca‑Cola grew 5%, driven by growth across all geographic operating segments. Coca‑Cola Zero Sugar grew 16%, driven by growth across all geographic operating segments. Diet Coke/Coca‑Cola Light grew 7%, driven by growth in North America and Asia Pacific. Sparkling flavors grew 4%, primarily driven by growth in Asia Pacific.
- Juice, value-added dairy and plant-based beverages grew 2%, driven by growth in Asia Pacific and North America.
- Water, sports, coffee and tea grew 6%. Water grew 6%, driven by growth in Asia Pacific, Europe, Middle East & Africa (“EMEA”) and Latin America. Sports drinks grew 5%, driven by growth in North America, EMEA and Asia Pacific. Coffee declined 2%, primarily driven by a decline in Asia Pacific. Tea grew 6%, driven by growth in EMEA, Latin America and Asia Pacific.
- Price/mix grew 2%, primarily driven by pricing actions in the marketplace, partially offset by unfavorable mix. Concentrate sales were 1 point behind unit case volume due to the timing of concentrate shipments.
- Operating income grew 9%, which included items impacting comparability and currency tailwinds. Comparable currency neutral operating income (non-GAAP) grew 6%, primarily driven by organic revenue (non-GAAP) growth and lower operating expenses, partially offset by higher input costs and an increase in marketing investments which was partially due to timing.
Europe, Middle East & Africa
- Unit case volume grew 4%, primarily driven by growth in Trademark Coca‑Cola and water, sports, coffee and tea.
- Price/mix grew 1%, primarily driven by pricing actions in the marketplace, partially offset by unfavorable mix. Concentrate sales were 3 points behind unit case volume due to the timing of concentrate shipments.
- Operating income declined 1%, which included items impacting comparability and a currency tailwind. Comparable currency neutral operating income (non-GAAP) declined 5%, primarily driven by an increase in marketing investments and higher operating expenses.
- The company gained value share in total NARTD beverages, led by share gains in Germany and Morocco.
Latin America
- Unit case volume grew 3%, primarily driven by growth in Trademark Coca‑Cola and water, sports, coffee and tea.
- Price/mix grew 3%, primarily driven by pricing actions in the marketplace, partially offset by unfavorable mix. Concentrate sales were 2 points behind unit case volume due to the timing of concentrate shipments.
- Operating income grew 23%, which included items impacting comparability and a currency tailwind. Comparable currency neutral operating income (non-GAAP) grew 4%, primarily driven by organic revenue (non-GAAP) growth and lower operating expenses, partially offset by an increase in marketing investments.
- The company gained value share in total NARTD beverages, led by share gains in Brazil and Mexico.
North America
- Unit case volume grew 3%, primarily driven by growth in Trademark Coca‑Cola and juice, value-added dairy and plant-based beverages.
- Price/mix grew 4%, primarily driven by pricing actions in the marketplace. Concentrate sales were in-line with unit case volume.
- Operating income grew 4%, which included items impacting comparability. Comparable currency neutral operating income (non-GAAP) grew 12%, primarily driven by organic revenue (non-GAAP) growth and lower operating expenses, partially offset by higher input costs and an increase in marketing investments.
- The company gained value share in total NARTD beverages, led by share gains in Trademark Coca‑Cola and juice, value-added dairy and plant-based beverages.
Asia Pacific
- Unit case volume grew 8%, primarily driven by growth in sparkling flavors and Trademark Coca‑Cola.
- Price/mix declined 9%, primarily driven by unfavorable mix and affordability initiatives. Concentrate sales were 3 points ahead of unit case volume due to the timing of concentrate shipments.
- Operating income grew 1%, which included items impacting comparability and a currency headwind. Comparable currency neutral operating income (non-GAAP) was even, as organic revenue (non-GAAP) growth and lower operating expenses were offset by higher input costs and an increase in marketing investments.
- The company lost value share in total NARTD beverages, as gains in Japan and China were more than offset by a loss in India.
Bottling Investments
- Unit case volume grew 5%, largely due to growth in India.
- Price/mix grew 2%, primarily driven by pricing actions in the marketplace and favorable mix.
- Operating income grew 55%, which included items impacting comparability, a currency headwind and the impact of refranchising bottling operations. Comparable currency neutral operating income (non-GAAP) grew 75%, primarily driven by organic revenue (non-GAAP) growth, partially offset by higher input costs.
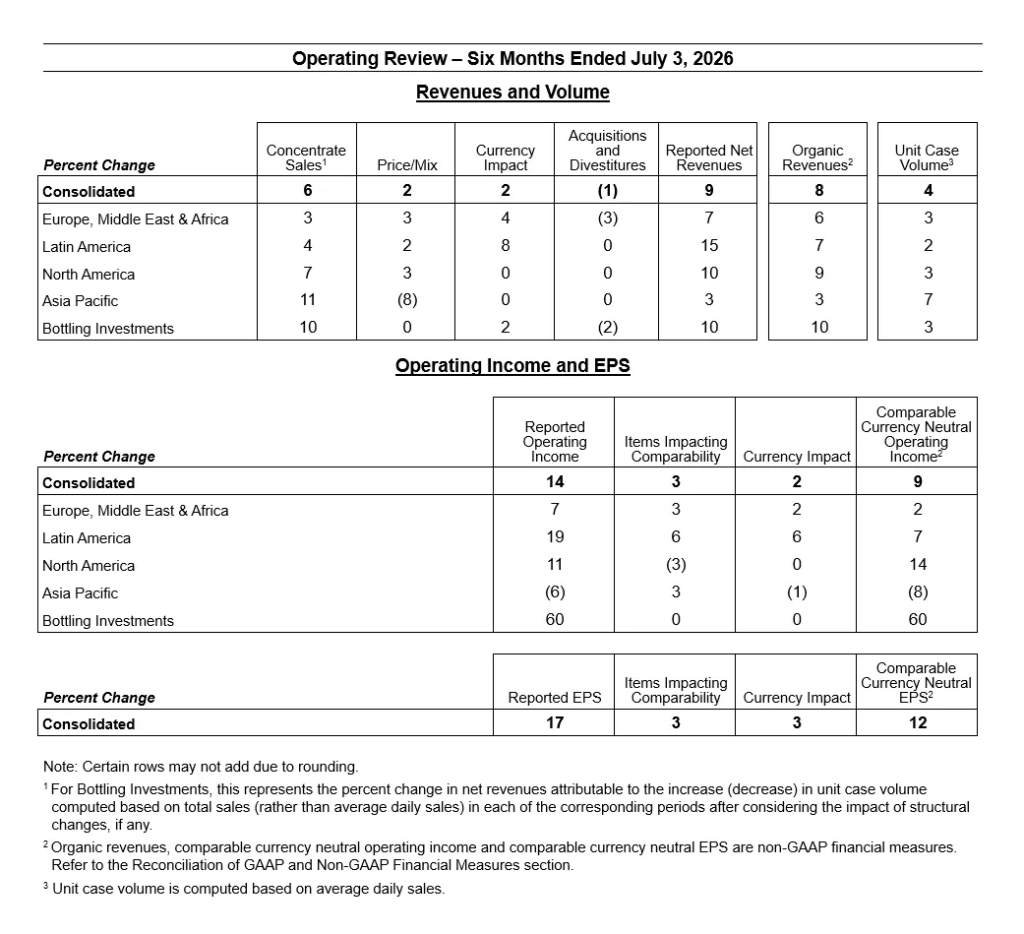
Operating Review – Six Months Ended July 3, 2026
Outlook
The 2026 outlook information provided below includes forward-looking non-GAAP financial measures, which management uses in measuring performance. The company is not able to reconcile full year 2026 projected organic revenues (non-GAAP) to full year 2026 projected reported net revenues, full year 2026 projected comparable net revenues (non-GAAP) to full year 2026 projected reported net revenues, full year 2026 projected underlying effective tax rate (non-GAAP) to full year 2026 projected reported effective tax rate, full year 2026 projected comparable currency neutral EPS excluding acquisitions and divestitures (non-GAAP) to full year 2026 projected reported EPS, or full year 2026 projected comparable EPS (non-GAAP) to full year 2026 projected reported EPS without unreasonable efforts because it is not possible to predict with a reasonable degree of certainty the exact timing and exact impact of acquisitions and divestitures throughout 2026; the exact timing and exact amount of items impacting comparability throughout 2026; and the exact impact of fluctuations in foreign currency exchange rates throughout 2026. The unavailable information could have a significant impact on the company’s full year 2026 reported financial results.